Your Plant Already Has Meters. You Still Can't Answer the Board.
- Every Indian factory we walk into already has 50–100+ meters — Schneider, Secure, HPL, L&T, Siemens — all producing data
- That data lands in SCADA tags, HMI screens, a Modbus poller, a CSV folder, a PowerBI dataset — five fragments, no record
- When the board asks "what did this plant cost last month, by line, by shift, with PF penalty and DSM exposure?" — the honest answer is a four-day firefight, not a query
The Incumbent Isn't a Vendor. It's Glue Code.
- If you added up the man-hours spent exporting, reconciling, formatting, and chasing meter data — you are already paying for an EMS. You just don't own it
- The glue-code EMS is unreproducible, auditor-hostile, and held together by one person's laptop — it breaks every re-instrumentation, every shift-timing change, every Windows update
- The competition isn't another vendor. It's this. And it is losing you evidence every month
SCADA Was Built for the Process. twinos Is Built for the Electrons.
- Don't replace SCADA. Don't touch the HMI. Don't disturb interlocks, trips, or batch sequencing — that's the process layer and it should stay exactly where it is
- twinos is a parallel layer — it reads the same meters, and builds the record SCADA was never designed to keep: energy, cost, shift, PQ, evidence
- Separation of concerns, not a turf war — your control engineer keeps SCADA, your energy manager gets twinos
Topology-Native, Protocol-Native, Shift-Native — From Line One.
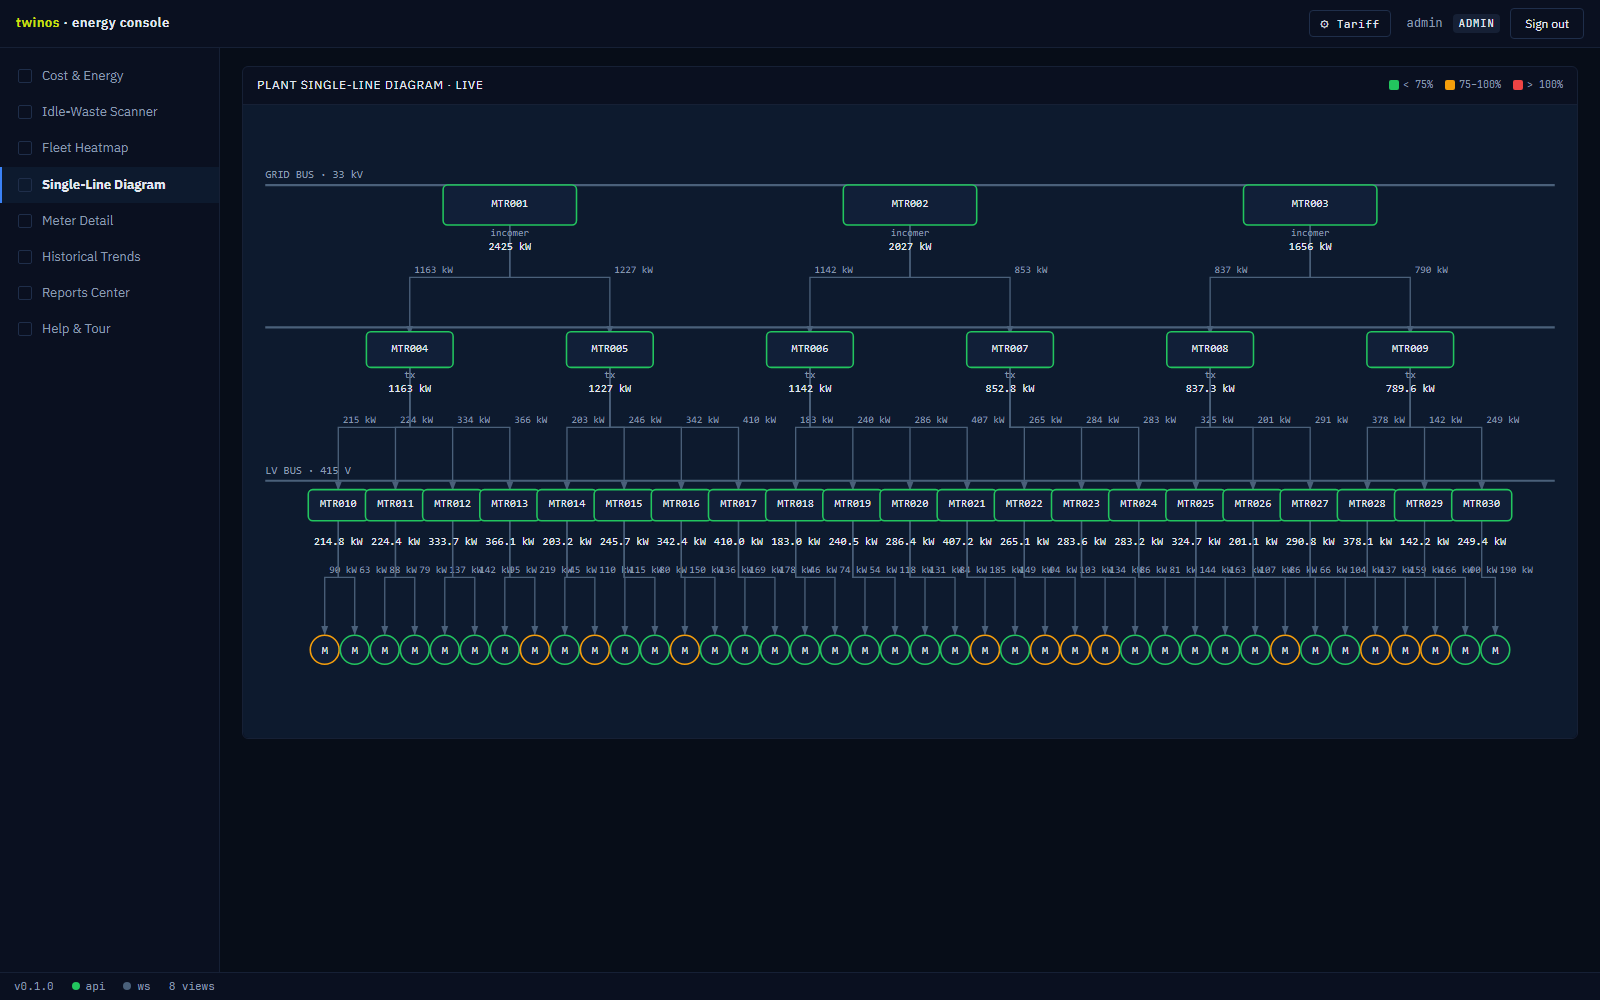
- Topology isn't a tag prefix — it's the data model: 3 Incomers → 6 Transformers → 21 Feeders → 40 Motors on a 70-meter demo, same shape on any plant
- Dual-protocol ingest — Modbus TCP AND IEC 61850 land as the same sample record in one service. No middleware, no OPC translator
- Shift is a first-class dimension from day one — 06-14 / 14-22 / 22-06 in plant-local timezone, overnight handled, DST handled
Bus Balance Is Not a Report. It's a Model.
The question your lender, your auditor, and your plant head all ask the same way: "of the electrons the incomer brought in, where did they go — and does it add up?" Your SCADA tag list does not know what an incomer is. It knows a tag called RMU_01_P. Excel can't fix that.
- Topology-aware reconciliation — incomer import minus feeder consumption, live, validated on every interval, for every rollup level
- Add a feeder? Rename a transformer? Re-bus a motor? The bus balance updates itself. The Excel reconciliation breaks
- This is month-end BRSR evidence, DSM audit evidence, and the answer to "where did the electrons go?" — as a structural property, not a monthly forensic exercise
Shift-Aware Is an Architecture, Not a Column.
- Shift A/B/C are configured once per deployment — timezone-aware, overnight-aware, and every query, every report, every dashboard respects them natively
- Shift-level rollups on cost, energy, PF, availability, and idle-waste — without anyone writing a new query when the shift timing changes
- Your operations review runs on shifts. Your reports should too — without a forensic spreadsheet to reconcile shift boundaries every week
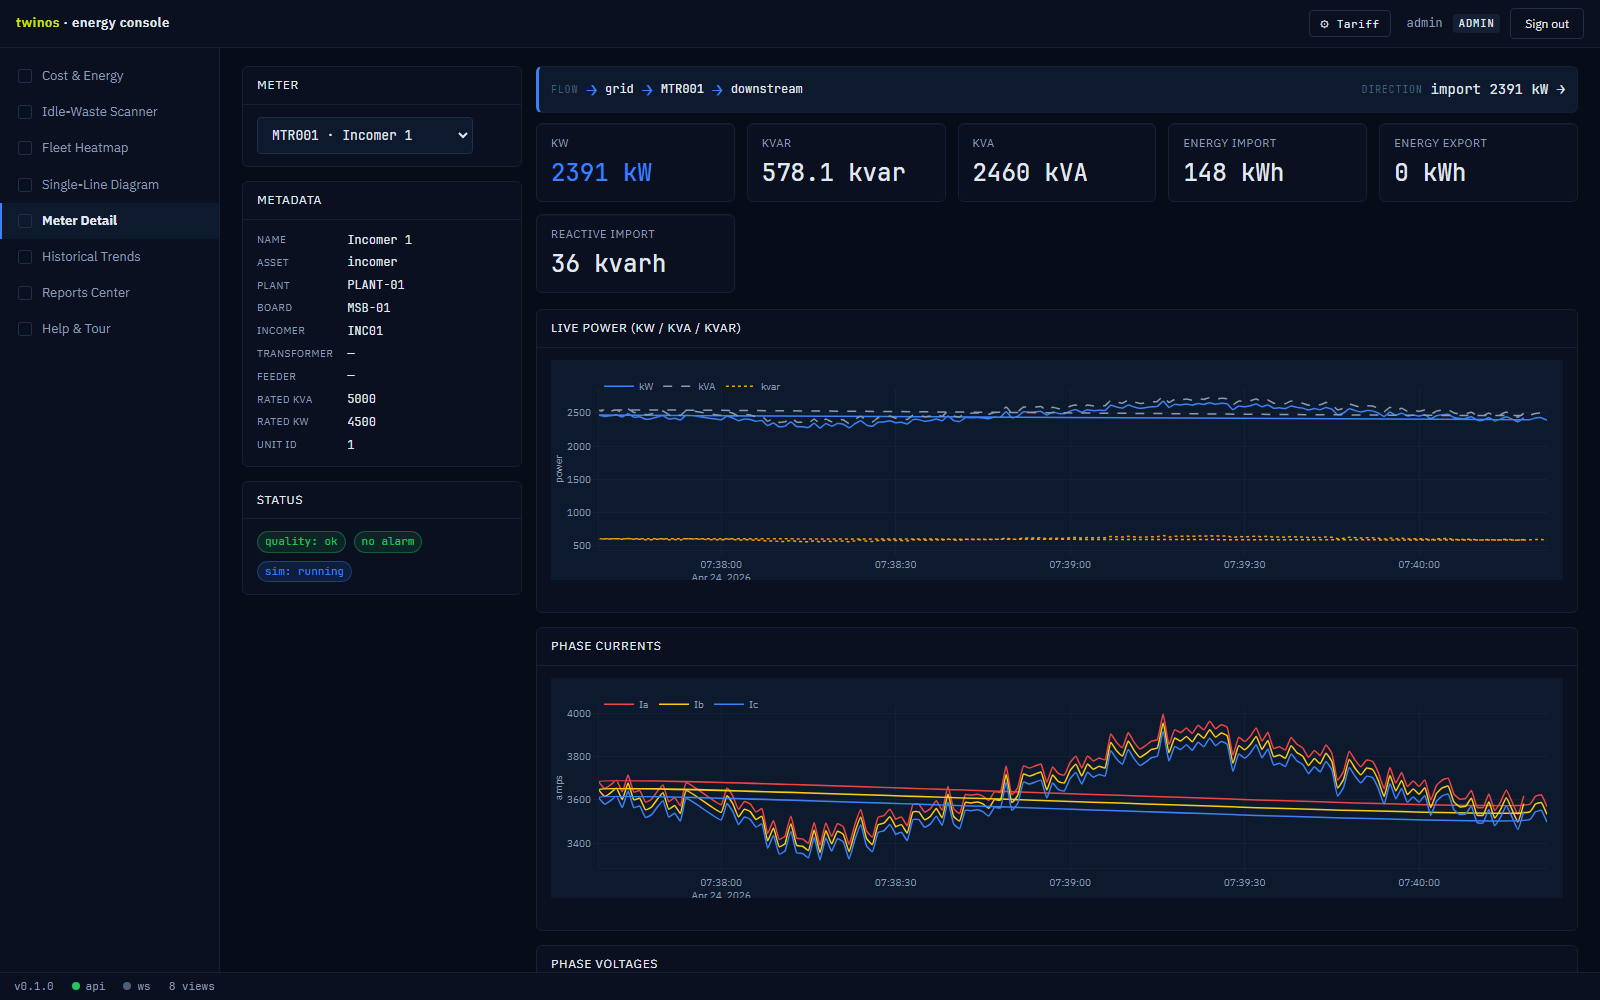
Power Quality + Cost — In the Same Record.
- Voltage under/over events, PF drift, data-quality intervals — captured in the same sample stream that drives the cost bar. No PQ add-on module, no separate historian
- BRSR Core / ISSB-grade power-quality evidence — already in the audit artifact, not something your team has to assemble after the reviewer asks
- DSM penalty risk surfaced in ₹ terms, not buried in a voltage log — the board sees the money, the engineer sees the event, both see the same record
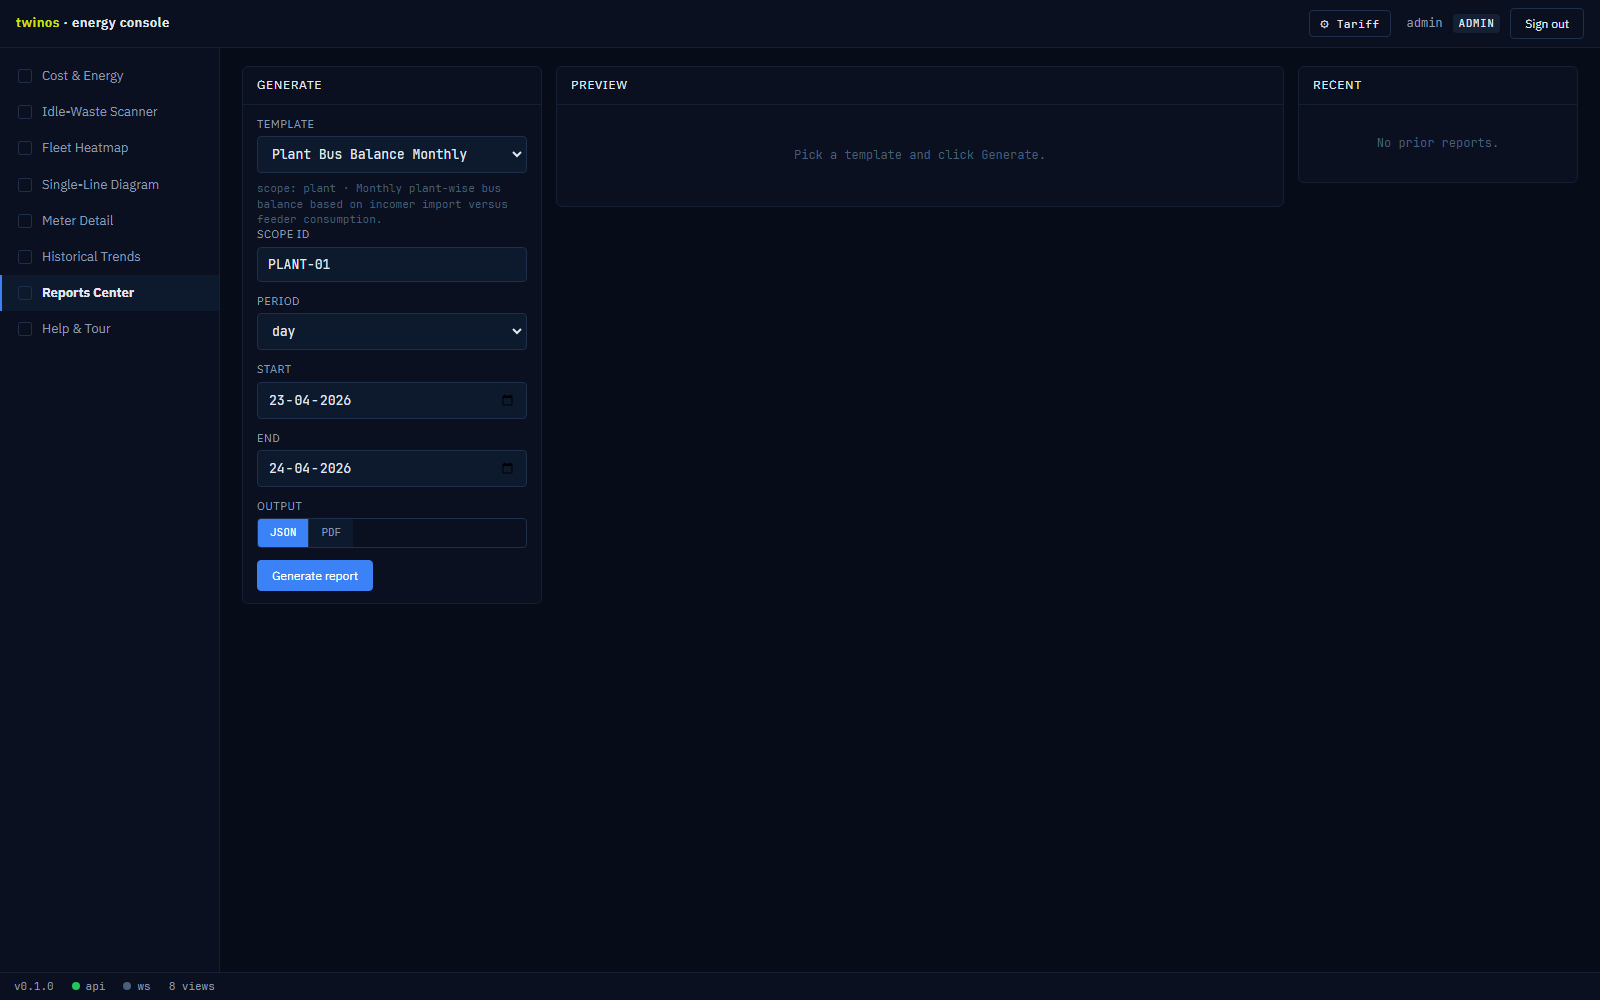
Reports Are Templates. Audits Are Artifacts.
- Bus Balance · Transformer Loading · Feeder / Motor daily-and-shift · Power Quality · Cost & Demand — nine templates ship on day one, both JSON and PDF
- Because the template is a file, not an HMI screen — you can diff it, review it, version it, audit it, and regenerate the same report six months later and get the same numbers
- Custom template? Edit a JSON file. Not a change order. Not a HMI rebuild. Not a quote.
Where twinos Sits. And Why Nobody Else Does.
The competition isn't another EMS vendor — it's the quiet cost of stitching five tools and one engineer together every month. And even the vendors who do sell you an EMS don't put all five capabilities in one layer.
| Capability | SCADA + Glue Code (what you have) | Other EMS Vendors (what the market sells) | twinos |
|---|---|---|---|
| Dual-protocol native (Modbus + IEC 61850) | Custom tag-mapping glue | Usually pick one | ✔ Native · one service |
| Topology-aware rollups (bus balance) | Excel approximation · brittle | Flat meter list | ✔ First-class data model |
| Shift as a dimension | CASE WHEN · breaks on DST | Calendar-only reports | ✔ Timezone-aware · overnight-safe |
| Power quality + cost in one record | Two pipelines · never in sync | PQ sold as separate module | ✔ Unified sample stream |
| Reports as versioned JSON templates | Bespoke Excel every month | Closed report-builder or HMI | ✔ Diff-able · reproducible |
| Auditor · lender · BRSR-grade evidence | Unreproducible | Disclosure-grade at best | ✔ Covenant-grade |
Single-Line Diagram
Fleet Heatmap
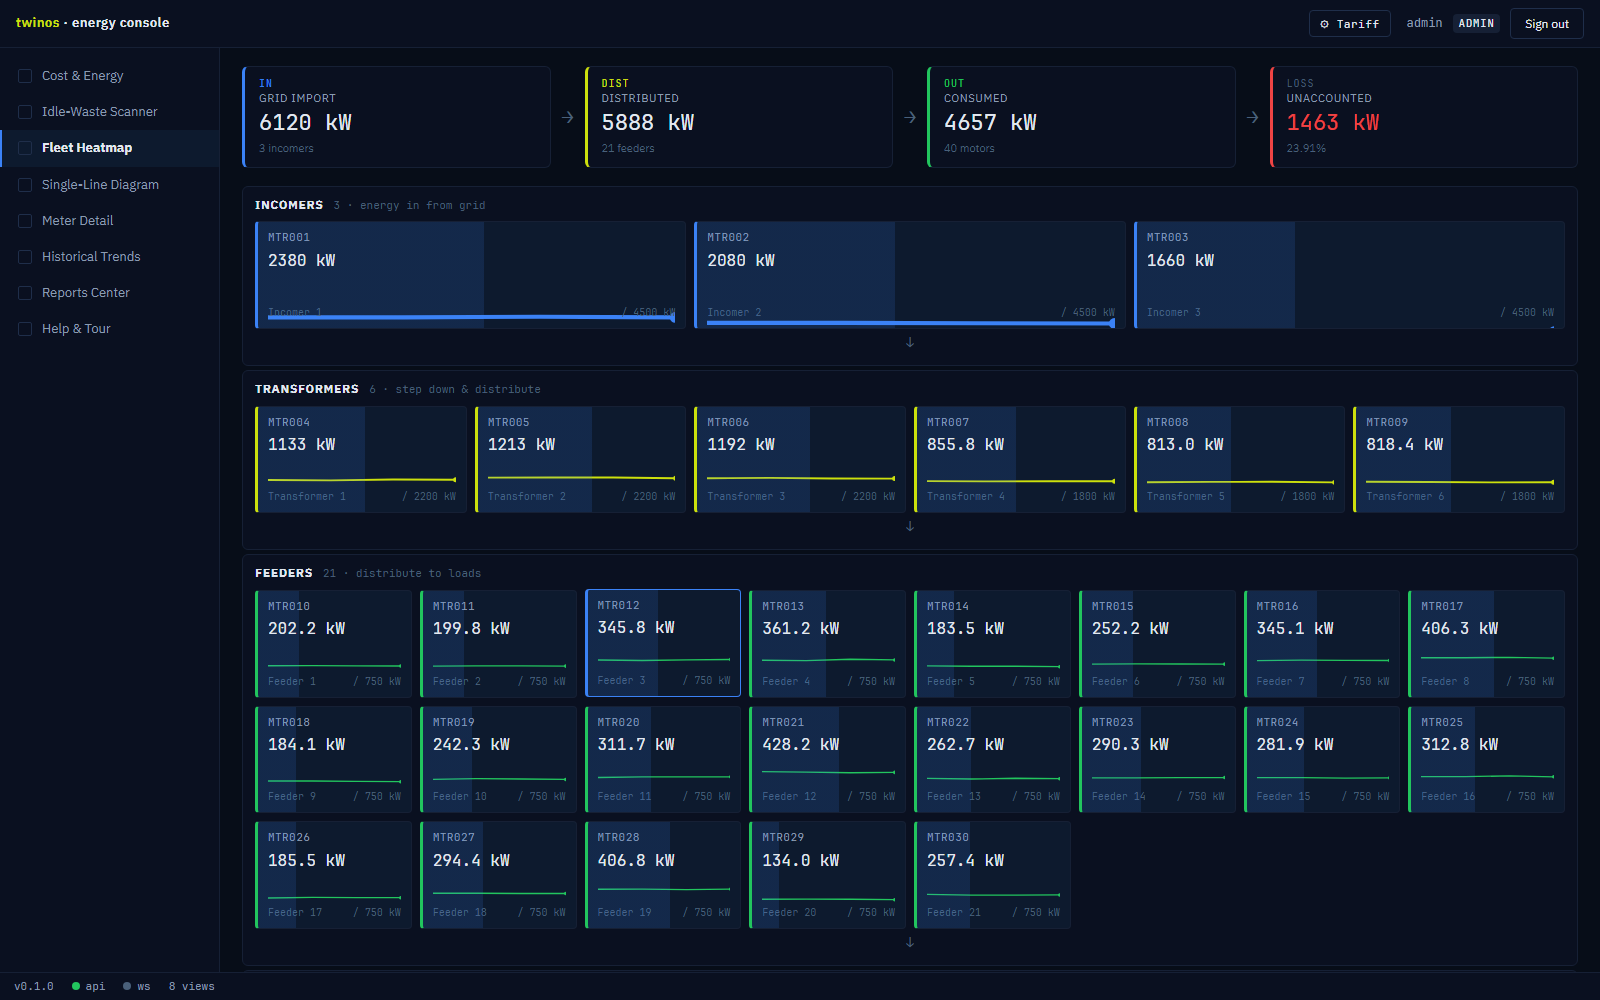
Fleet → One Motor In Two Clicks
Meter Detail — live
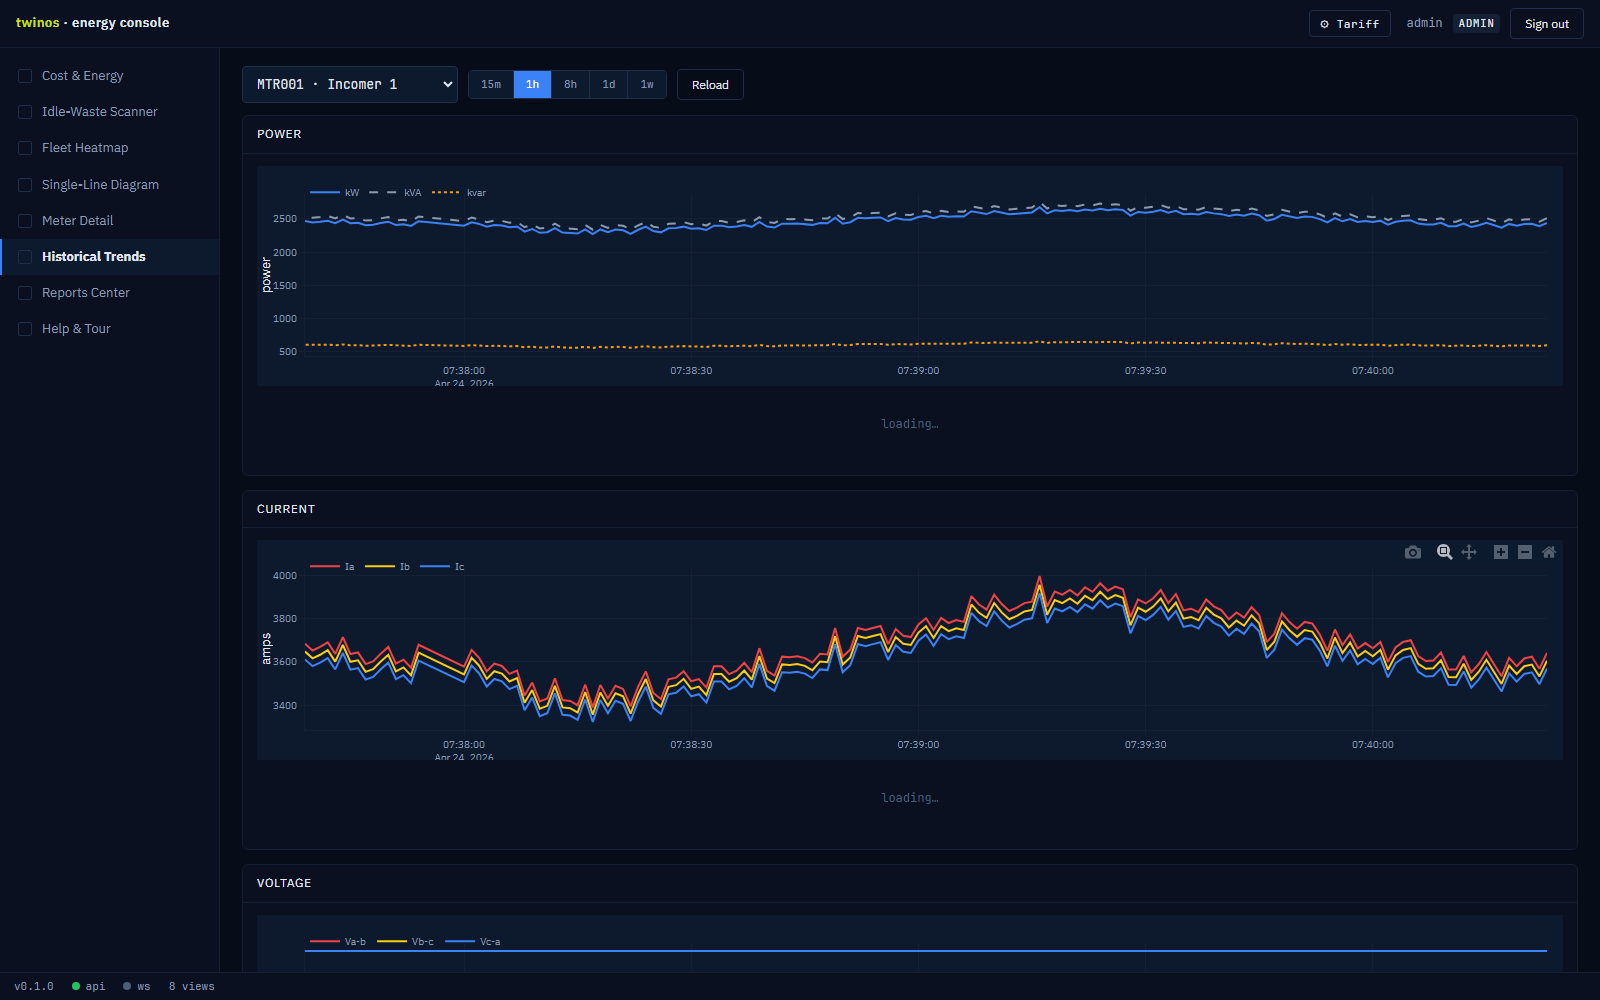
Historical Trends
Templates. Not Rebuilt HMI Screens.
Reports Center
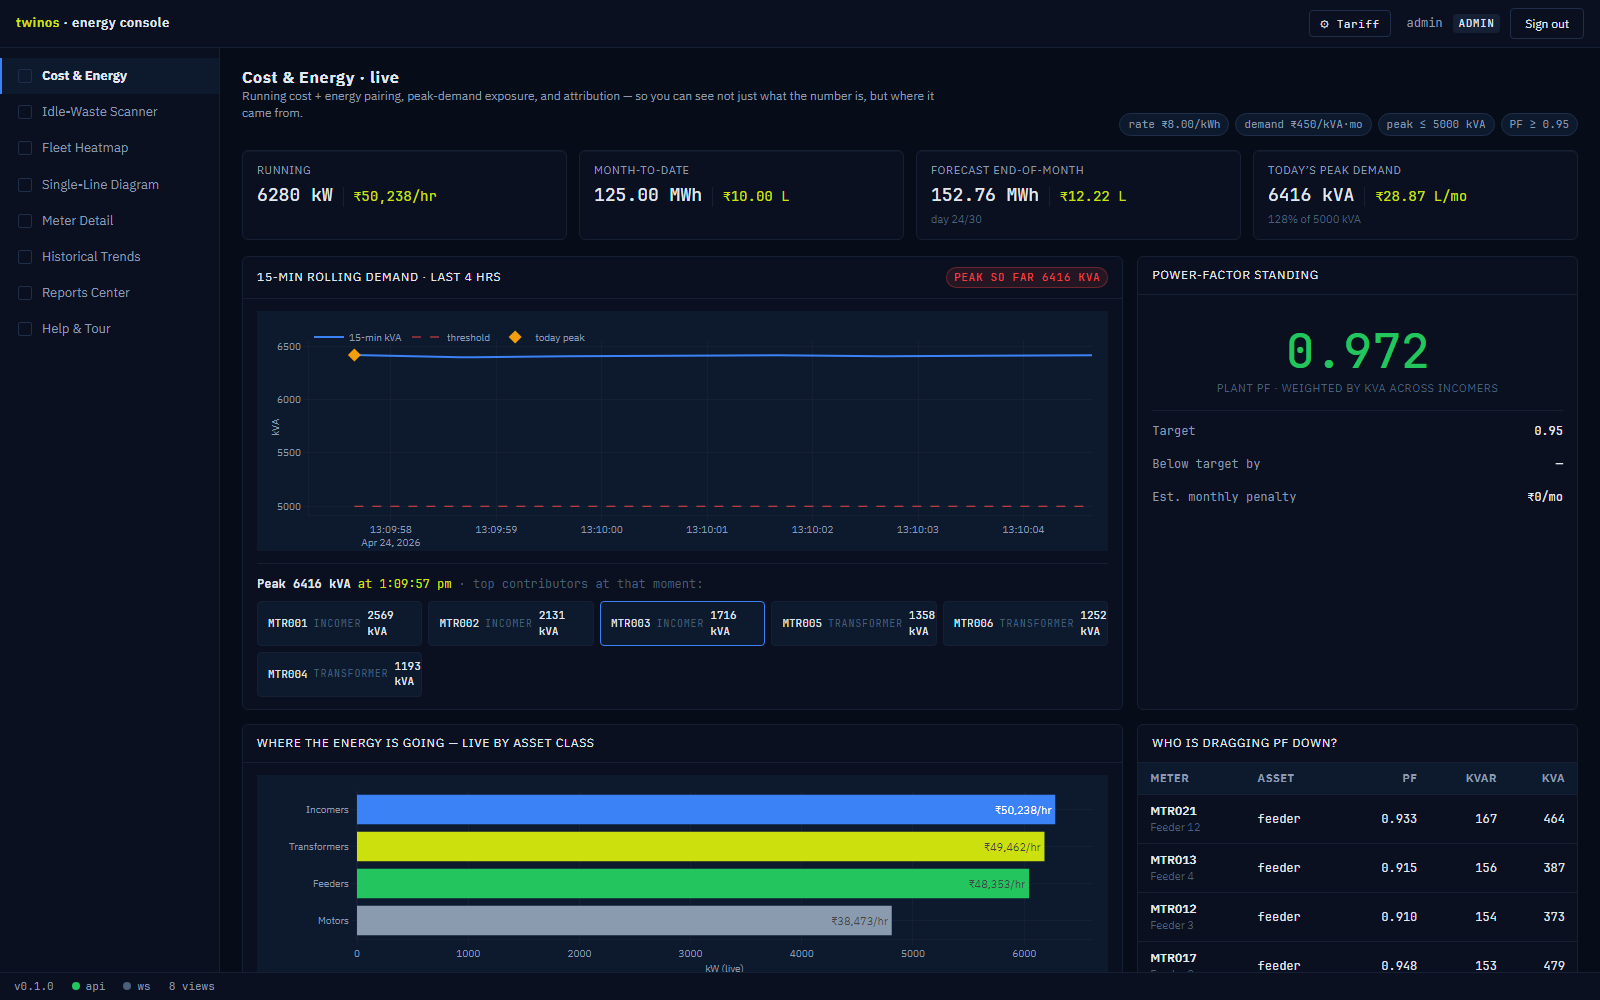
Cost & Energy — live
Deploy. Pilot. Scale. — Let's Talk.
What a Pilot Looks Like
- Week 1 — Topology + tariff configuration, edge adapter on one transformer bay
- Week 4 — First 10–15 live meters streaming into twinos, first shift reports generated
- Week 12 — Full plant fleet on twinos, reports automated, glue-code pipeline decommissioned
- Runs in parallel with SCADA throughout — zero disruption to the process layer
- Deliverables: topology model, report templates, trained operators, 12 weeks of live evidence in the archive
Contact Us
- [ Primary Contact Name · Title ]
- [ info@lesgroup.in ]
- [ +91 #### ### ### ]
- [ www.lesgroup.in ]
- Live demo — this deck is running on our own simulator at http://localhost:8600
- Next step — a 60-minute call + a 2-hour topology walk-through of your plant